
Performance as a Ranking Signal and a User Experience Signal
Web performance has two audiences: the search engine algorithms that use performance signals as ranking factors, and the actual users whose experience is directly affected by how fast pages load and respond. These audiences sometimes diverge — a performance optimisation that improves a measured metric without improving perceived user experience, or vice versa — but they more often align: pages that load quickly and respond immediately to interaction provide both better search ranking signals and better user experience.
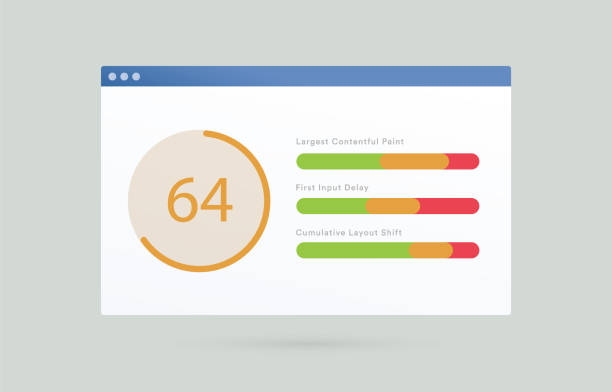
Google’s Core Web Vitals, introduced as a ranking signal update in 2021 and continuously refined since, represent Google’s attempt to measure the aspects of performance that most directly affect user experience: how quickly the main content appears, how quickly the page responds to interaction, and whether visual elements jump around while the page loads. Understanding what each metric measures, what causes poor scores, and which fixes actually move the needle distinguishes effective performance optimisation from metric gaming.
INP: The Metric That Replaced FID
Interaction to Next Paint (INP) replaced First Input Delay (FID) as a Core Web Vital in March 2024. FID measured only the delay before the browser could begin processing an interaction; INP measures the full time from user interaction (click, key press, tap) to the next visual update on the screen — a more complete measure of perceived responsiveness.
INP scores above 500 milliseconds are considered poor (users perceive the page as unresponsive); scores below 200 milliseconds are good; scores between 200 and 500 milliseconds need improvement. Pages with heavy JavaScript execution that blocks the main thread — long-running scripts, complex calculations performed synchronously, third-party scripts that execute at interaction time — have poor INP scores because they delay the visual response to user input. The fixes: breaking long tasks into smaller chunks, using web workers for off-main-thread processing, deferring non-critical JavaScript, and optimising third-party script loading.
LCP: Getting the Largest Element Loading Fast
Largest Contentful Paint (LCP) measures when the largest visible element in the viewport — typically a hero image, a heading, or a video thumbnail — becomes visible. Poor LCP (above 4 seconds) tells users that the page isn’t loading, even if other content appeared earlier. Good LCP (below 2.5 seconds) produces the perception of a fast page load.
The most impactful LCP improvements: preloading the LCP element (adding <link rel=’preload’> for the hero image tells the browser to fetch it early in the loading sequence rather than waiting to discover it in the HTML); using a CDN that delivers the image from a server physically close to the user; optimising the image format and size (WebP at appropriate dimensions rather than large JPEG files that browsers must decode); and removing render-blocking resources (CSS and JavaScript that must be processed before the browser can paint the LCP element).
CLS: Stopping the Layout Jumps
Cumulative Layout Shift (CLS) measures visual instability — how much page elements jump around while the page loads. A page where the user clicks a button and hits an ad that shifted into place at the wrong moment, or begins reading an article that jumps when an image loads above the text, has a high CLS score and a frustrating user experience.
The CLS fixes that have the most impact: adding width and height attributes to all images and video elements (so the browser reserves the correct space before they load, rather than allocating space when they arrive and shifting content below them); avoiding inserting content above existing content after the page loads (ad slots that appear above text after initial render are a common CLS source); and ensuring custom fonts don’t cause text reflow when they load by using font-display: optional or font-display: swap with fallback fonts sized to approximately match the web font.
Measuring What Actually Matters: Field Data vs Lab Data
Web performance can be measured in two ways: lab data (Lighthouse audits run on demand in a controlled environment) and field data (real user measurements collected as actual users load pages). Lab data is useful for development and debugging but doesn’t represent what real users experience — the lab environment has no ad content, no third-party scripts from campaigns, and no variable network conditions. Field data from Google Search Console’s Core Web Vitals report and from the Chrome User Experience Report (CrUX) shows what real users actually experience.
The performance optimisation that improves Lighthouse scores without improving field data doesn’t help search rankings or users; the optimisation that improves field data does both. When lab and field data diverge significantly, investigate what’s running on the real user’s page that isn’t in the lab environment — typically third-party scripts (ads, analytics, chat widgets, social embeds) that execute after the lab test has completed but that significantly affect real user experience. Tag auditing and third-party script governance are often the highest-impact performance improvements for real-world sites that have already addressed the most obvious first-party performance issues.